Profiling WebApi projects
.net WebApi MiniProfiler swagger swashbuckle webIntroduction #
In the last few weeks I've been working on a couple of WebApi projects and one thing I have been missing, was a good profiling tool to keep an eye on the performance of the controller actions. A quick search concluded that there was no suitable solution; there are a number of stand alone profilers, like Stackify that do a satisfactory job, but since it is running on your local machine its not straightforward to profile your code once deployed on a different environment. Developers that used MVC in the past have tools like MiniProfiler and Glimpse that run as part of the web project and shows on the fly results which makes them more convenient to use.
Sadly both MiniProfiler and Glimpse don't work out of the box with WebApi for two main reasons: although WebApi and MVC share similar patterns, they are not exactly the same and run on different namespaces and dlls; secondly WebApi does not usually have a GUI to interact with.
The lack of GUI can be solved with other tools like Swagger and its awesome wrapper for .net swashbuckle, and lack of MiniProfiler support for WebApi can be hacked in. So then its a matter of combining the two.
This article explains how to accomplish that. So let's get started!
Breaking down the problem #
So in essence, using MiniProfiler with swagger can be broken down to three parts:
- How to profile a WebApi project.
- How to send profiling information from backend to the UI
- Show profiling results in the UI
Setup #
Before we start solving the problem let's set up an example project.
-
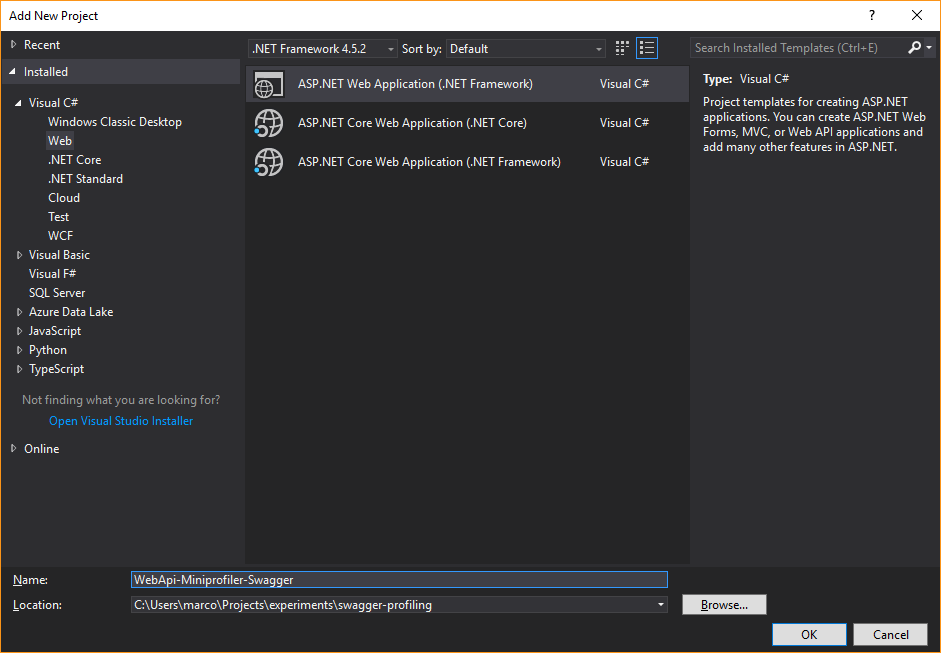
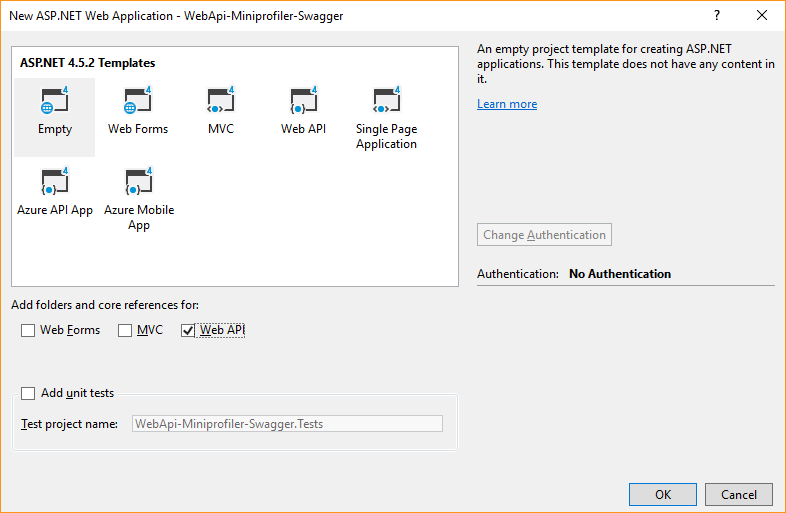
First let's create a WebApi project.
-
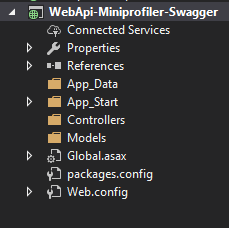
Following the above steps should create the following structure.
-
Create a controller (which I'm calling default ) and add the following code
using System.Web.Http;

namespace WebApi_MiniProfiler_Swagger.Controllers
{
    [RoutePrefix("api/v1/default")]
    public class DefaultController : ApiController
    {
        [Route("")]
        public IHttpActionResult Get()
        {
            return Json(new
            {
                Name = "Marco",
                Description = "I need some profiling!`"
            });
        }
    }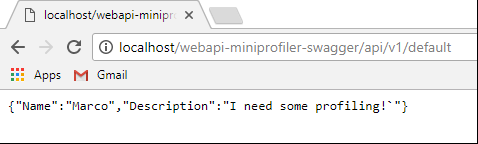
}- Compile and navigate to the url api and you should see the action output
Now let`s add swagger to our project #
- Open the nuget console and install swashbuckle
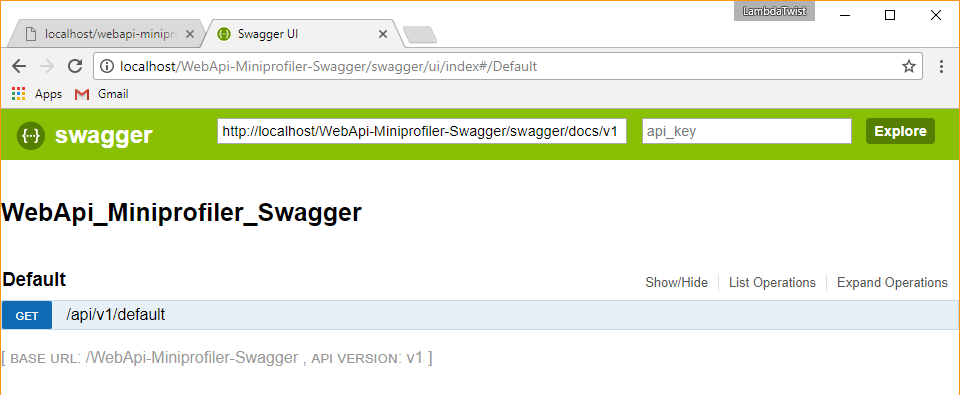
Install-Package Swashbuckle - Compile the project again and navigate to your root url /swagger
1. How to profile a WebApi project. #
Setting up MiniProfiler
Before we get into how to integrate MiniProfiler its useful to have a general idea of what MiniProfiler does when profiling an mvc project. When a controller action is exectued, mini profiler keeps track of the execution times using a guid for every request. When the action completes the result is stored in memory. MiniProfiler then signals its javascript module that a new action has executed. This then makes a call to a special MiniProfiler endpoint to get the timing results. Unfortunately this is an mvc endpoint but luckily exposing this endpoint in a WebApi project is straightforward.
- First let`s install MiniProfiler.
Install-Package MiniProfiler- We do not need the MiniProfiler.mvc library only the MiniProfiler core but make sure you install the latest v3 module. At the time of writing thats version 3.2.x I explain further down why version 3.0 does not work.
Install-Package Microsoft.AspNet.Mvc- Add the following to your web.config under
<handlers>
<add name="MiniProfiler" path="mini-profiler-resources/*" verb="*"
type="System.Web.Routing.UrlRoutingModule" resourceType="Unspecified"
preCondition="integratedMode" />- Add the following code to Global.asax.cs
protected void Application_BeginRequest()
{
    MiniProfiler.Start();
}

protected void Application_EndRequest()
{
    MiniProfiler.Stop();
}- To test that everything is wired up correctly
- Rebuild your solution and execute GET action in swagger.
- Then navigate to the following endpoint
- If mini profiler works you should see something similar

2. How to send profiling information from backend to the UI #
Inject MiniProfiler metadata in swashbuckle
In an mvc project we normally add a helper method RenderInclude in our razor views, this injects
some code that executes and renders the profiling boxes.
Since in WebApi we don''t usually have a page to inject too we''ll have to be a bit more creative.
If we look at the output of RenderIncludes we observe that mini profiler inserts an async script tag.
This tag then downloads a JS script from the MiniProfiler endpoint which is then run to display the profiling results.
Looking at the swagger documentation there is a way of injecting information as text, and it also allows for javascript to be run with the page. That should be enough the get us going.
- First lets add a swagger document filter.
- This filter executes every time the swagger page is loaded
- The code below takes the MiniProfiler script tag and inserts it as the api author (very hacky but bear with me)
using System.Web.Http.Description;
using StackExchange.Profiling;
using Swashbuckle.Swagger;

namespace WebApi_MiniProfiler_Swagger.Filters
{
    public class InjectMiniProfiler : IDocumentFilter
    {
        public void Apply(SwaggerDocument swaggerDoc, SchemaRegistry schemaRegistry, IApiExplorer apiExplorer)
        {
            swaggerDoc.info.contact = new Contact()
            {
                name = MiniProfiler.RenderIncludes().ToHtmlString()
            };
        }
    }
}- Uncomment the documentfilter code in swaggerconfigs.cs add point it to the newly created filter
c.DocumentFilter<InjectMiniProfiler>(); - Compile and refresh the swagger page and you see that the api was created by Mr script async.
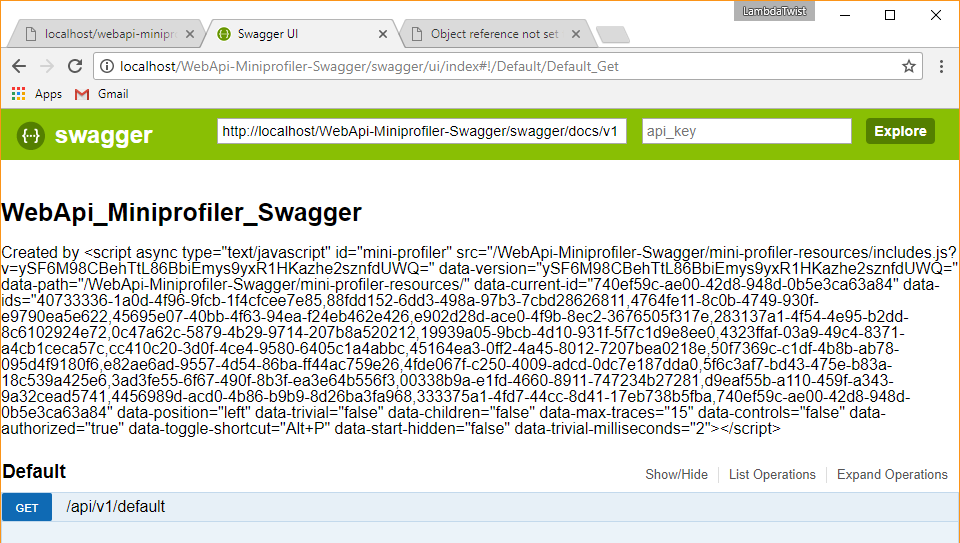
- As you can see we have the information we need on the client side. Now we just need to process it with some javascript.
3. Show profiling results in the UI #
How to run MiniProfiler JS on a swagger page.
- Add a javascript file to the project and call it
SwaggerUiCustomization.js - Change it to be an embedded resource and make sure it is always copied to the output directory
- Then add the following javascript
- This code basically finds the text we injected (using JQuery), creates a new script tag with that information, then appends it to the DOM. This then executes the javascript.
//Create a mini profiler script tag with the right properites
var MiniProfiler = $('#api_info > div:nth-child(3)').text();

const attributes = [
    'src', 'data-version', 'data-path', 'data-current-id', 'data-ids',
    'data-position', 'data-trivial', 'data-children', 'data-max-traces', 'data-controls',
    'data-authorized', 'data-toggle-shortcut', 'data-start-hidden', 'data-trivial-milliseconds'
];

var GetAttr = function (input, attributeName) {
    const myRegexp = attributeName + '="(.*?)"';
    const re = new RegExp(myRegexp, "g");
    const match = re.exec(input);
    return match[1];
}
var s = document.createElement("script");
s.type = "text/javascript";
s.id = "mini-profiler";
s.async = true;

for (var i = 0; i < attributes.length; i++) {
    var element = attributes[i];
    s.setAttribute(element, GetAttr(MiniProfiler, element));
}
document.body.appendChild(s);

// Remove injected tag from view
$('#api_info > div:nth-child(3)').text('');- Recompile and refresh swagger
- Uncomment the injectjavascript attribute inside swaggerconfig.cs and point it to the javascript you created. E.g
c.InjectJavaScript(thisAssembly, "WebApi_MiniProfiler_Swagger.App_Start.SwaggerUiCustomization.js"); - The injected text should have disappeared and the MiniProfiler popup should appear on the left
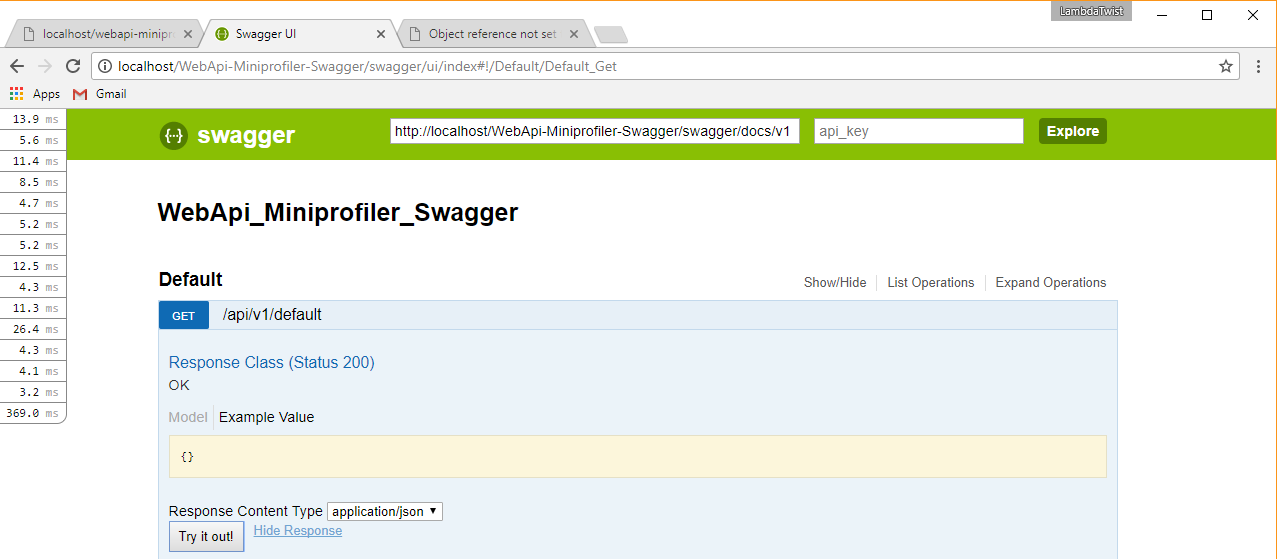
- Yay !!
Unfortunately we are not done. If you click on the GET action try it out button, MiniProfiler does not update making the whole thing useless. Luckily for us MiniProfiler is designed to also work with ajax calls in mvc websites, so with a few more hacks we can get it to work. Scanning through the MiniProfiler js code we find that it can listen to the xhr object of the page if its an angular app.
- So lets add
window.angular = true;to our SwaggerUiCustomization.js file and pretend we are using angular.- Note: This is why it's important to use version 3.2 of MiniProfiler. version 3.0 had a bug with the xhr listener that caused stackoverflow errors. If your browser console throws stackoverflow exceptions, double check you are running the correct version of MiniProfiler.
- Recompile the solution and refresh swagger.
- So far we only enables MiniProfiler to listen to new calls. For the information to display we also need to transmit the IDS of the profiled actions.
- This can be easily done using another filter.
- Create a new class and call it
WebApiProfilingActionFilter.csand add the following code:
using System.Web.Http.Filters;
using Newtonsoft.Json;
using StackExchange.Profiling;

namespace WebApi_MiniProfiler_Swagger.Filters
{
    public class WebApiProfilingActionFilter : ActionFilterAttribute
    {
        public const string MiniProfilerResultsHeaderName = "X-MiniProfiler-Ids";

        public override void OnActionExecuted(HttpActionExecutedContext filterContext)
        {
            var MiniProfilerJson = JsonConvert.SerializeObject(new[] {MiniProfiler.Current.Id});
            filterContext.Response.Content.Headers.Add(MiniProfilerResultsHeaderName, MiniProfilerJson);
        }
    }
}-
In
WepApiConfig.csregister the filterconfig.Filters.Add(new WebApiProfilingActionFilter()); -
Recompile and give it another try.
-
Every time you run an action a new box should be added on the left hand side.
-
In addition in the response headers you should see a similar entry
"x-MiniProfiler-ids": "[\"b9512f60-9e75-42f9-bdc1-597695e5b745\"]", -
So in conclusion. Double yay!!
-
Now lets add a few more actions and make sure everything works
   [Route("step")]
    public IHttpActionResult GetWithStep()
    {
        var profiler = MiniProfiler.Current;

        using (profiler.Step("Starting a profiling Step"))
        {
            return Json(new
            {
                Name = "Marco",
                Description = "I haz profiling!`"
            });
        }
    }

    [Route("notfound")]
    public IHttpActionResult NothingToSeeHere()
    {
        return NotFound();
    }

    [HttpPost]
    [Route("posting")]
    public IHttpActionResult PostSomething(string stuff)
    {
        return Ok();
    }

    [Route("broken")]
    public IHttpActionResult ThrowAnError()
    {
        throw new Exception("Error error");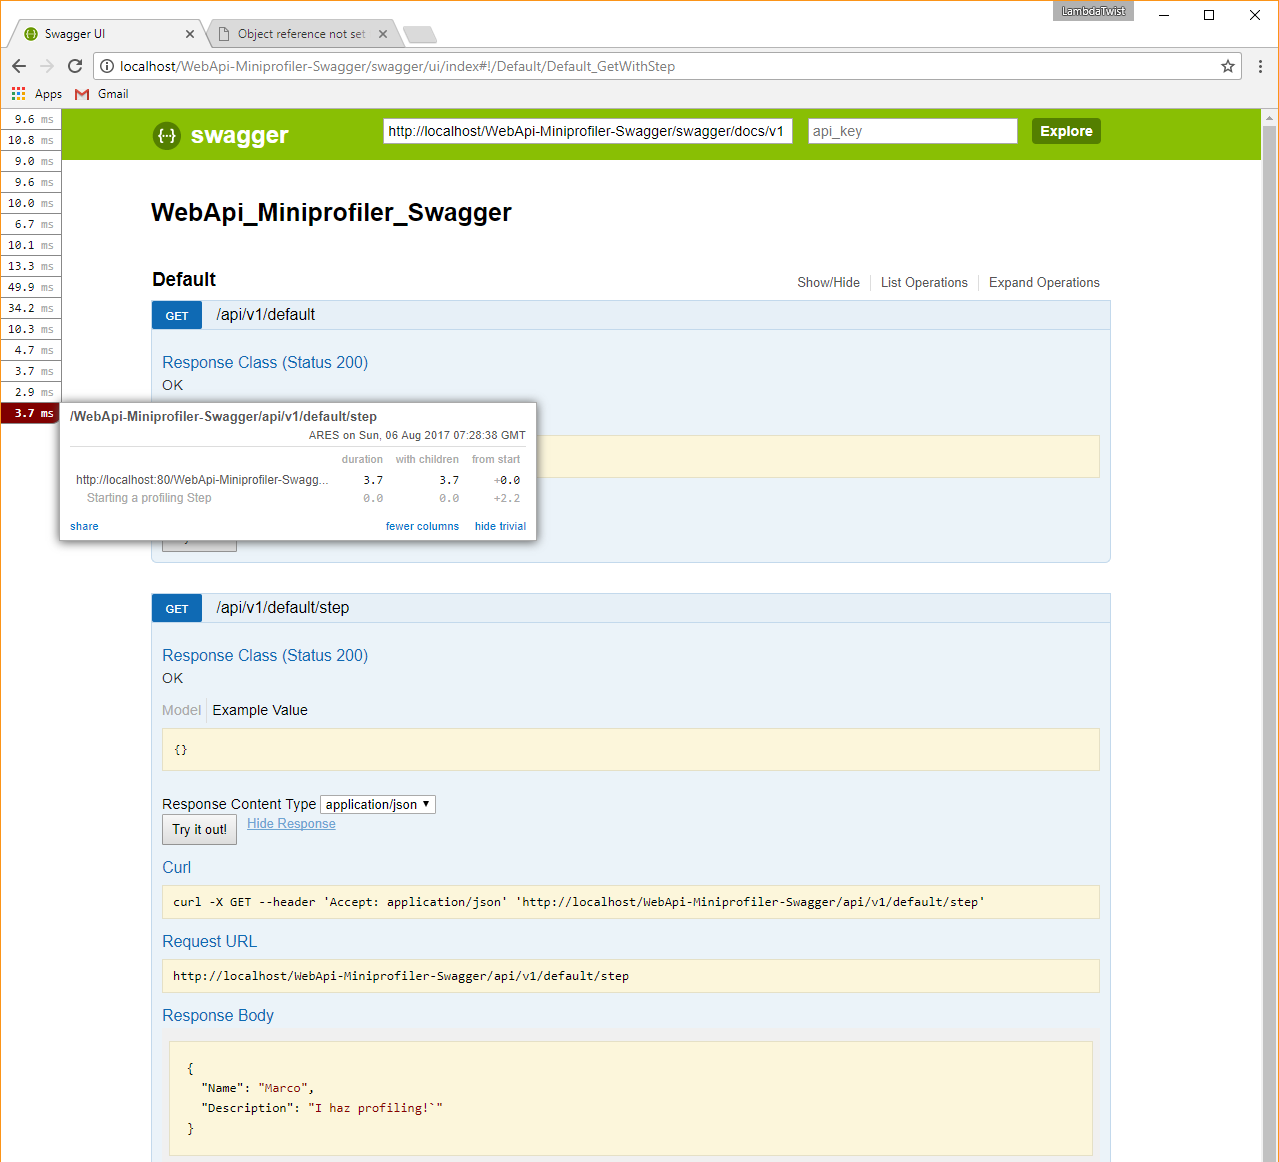
}- Try out the new actions, and with every execution the popup should update with more timings. Looks good to me!
Conclusion #
Looking at the code in its final form makes it look simple enough, but it took a fair amount of trial and error to get swashbuckle and MiniProfiler working and some more refactoring to cut down the code, but I am pretty pleased with the result. It would be nice if swashbuckle has an easier way to pass down metadata into swagger. I know they support custom front pages but what we needed here is a small tweak rather than build a whole page from scratch. MiniProfiler could provide out of the box support for WebApi since its one of the most used profiling tools.
Once all this is set up we can use all the other MiniProfiler plugins such as Entity framework profiling. Works out of the box.
I uploaded a full example of the code in the this post here{:target="_blank"}, hope you will find it useful.
If you have any questions, comments or suggestions, please leave them below.
Some useful links: MiniProfiler{:target="_blank"} Swashbuckle{:target="_blank"}